2. Efficient Figure Creation Tips: Abstracting Common Steps#
In this section#
We will encapsulate common plotting patterns into classes and functions. Encapsulating logic within functions will allow us to create complex figures with less code and make experiments more enjoyable and less error-prone.
Creating abstractions#
When creating a new figure, you usually start with a new script.
There is nothing wrong with starting with a new script whenever you want to create a new figure. However, as time passes, you will notice you are repeating yourself. At the same time, maintaining your code is getting harder and harder. You’ll discover something cool and new and would also like the older code to benefit from it.
The solution for this is to review your code refactor often. Let’s take a practical look at this.
First, we will see how to use the custom-written code to generate complex images. If you are convinced that it’s worth it, there is a second notebook that guides you through the details.
List of Exercises#
Exercise 1#
Description:
Implement a Vector class that represents a vector in 2D space. Use a plot method similar to the Point class.
A class should have a constructor __init__(self, …).
A class should have a method __str__(self) that will return a string representation of the object.
A class should have a method plot(self, ax, kwargs) that will plot the vector on the axes.
Exercise 2#
Description
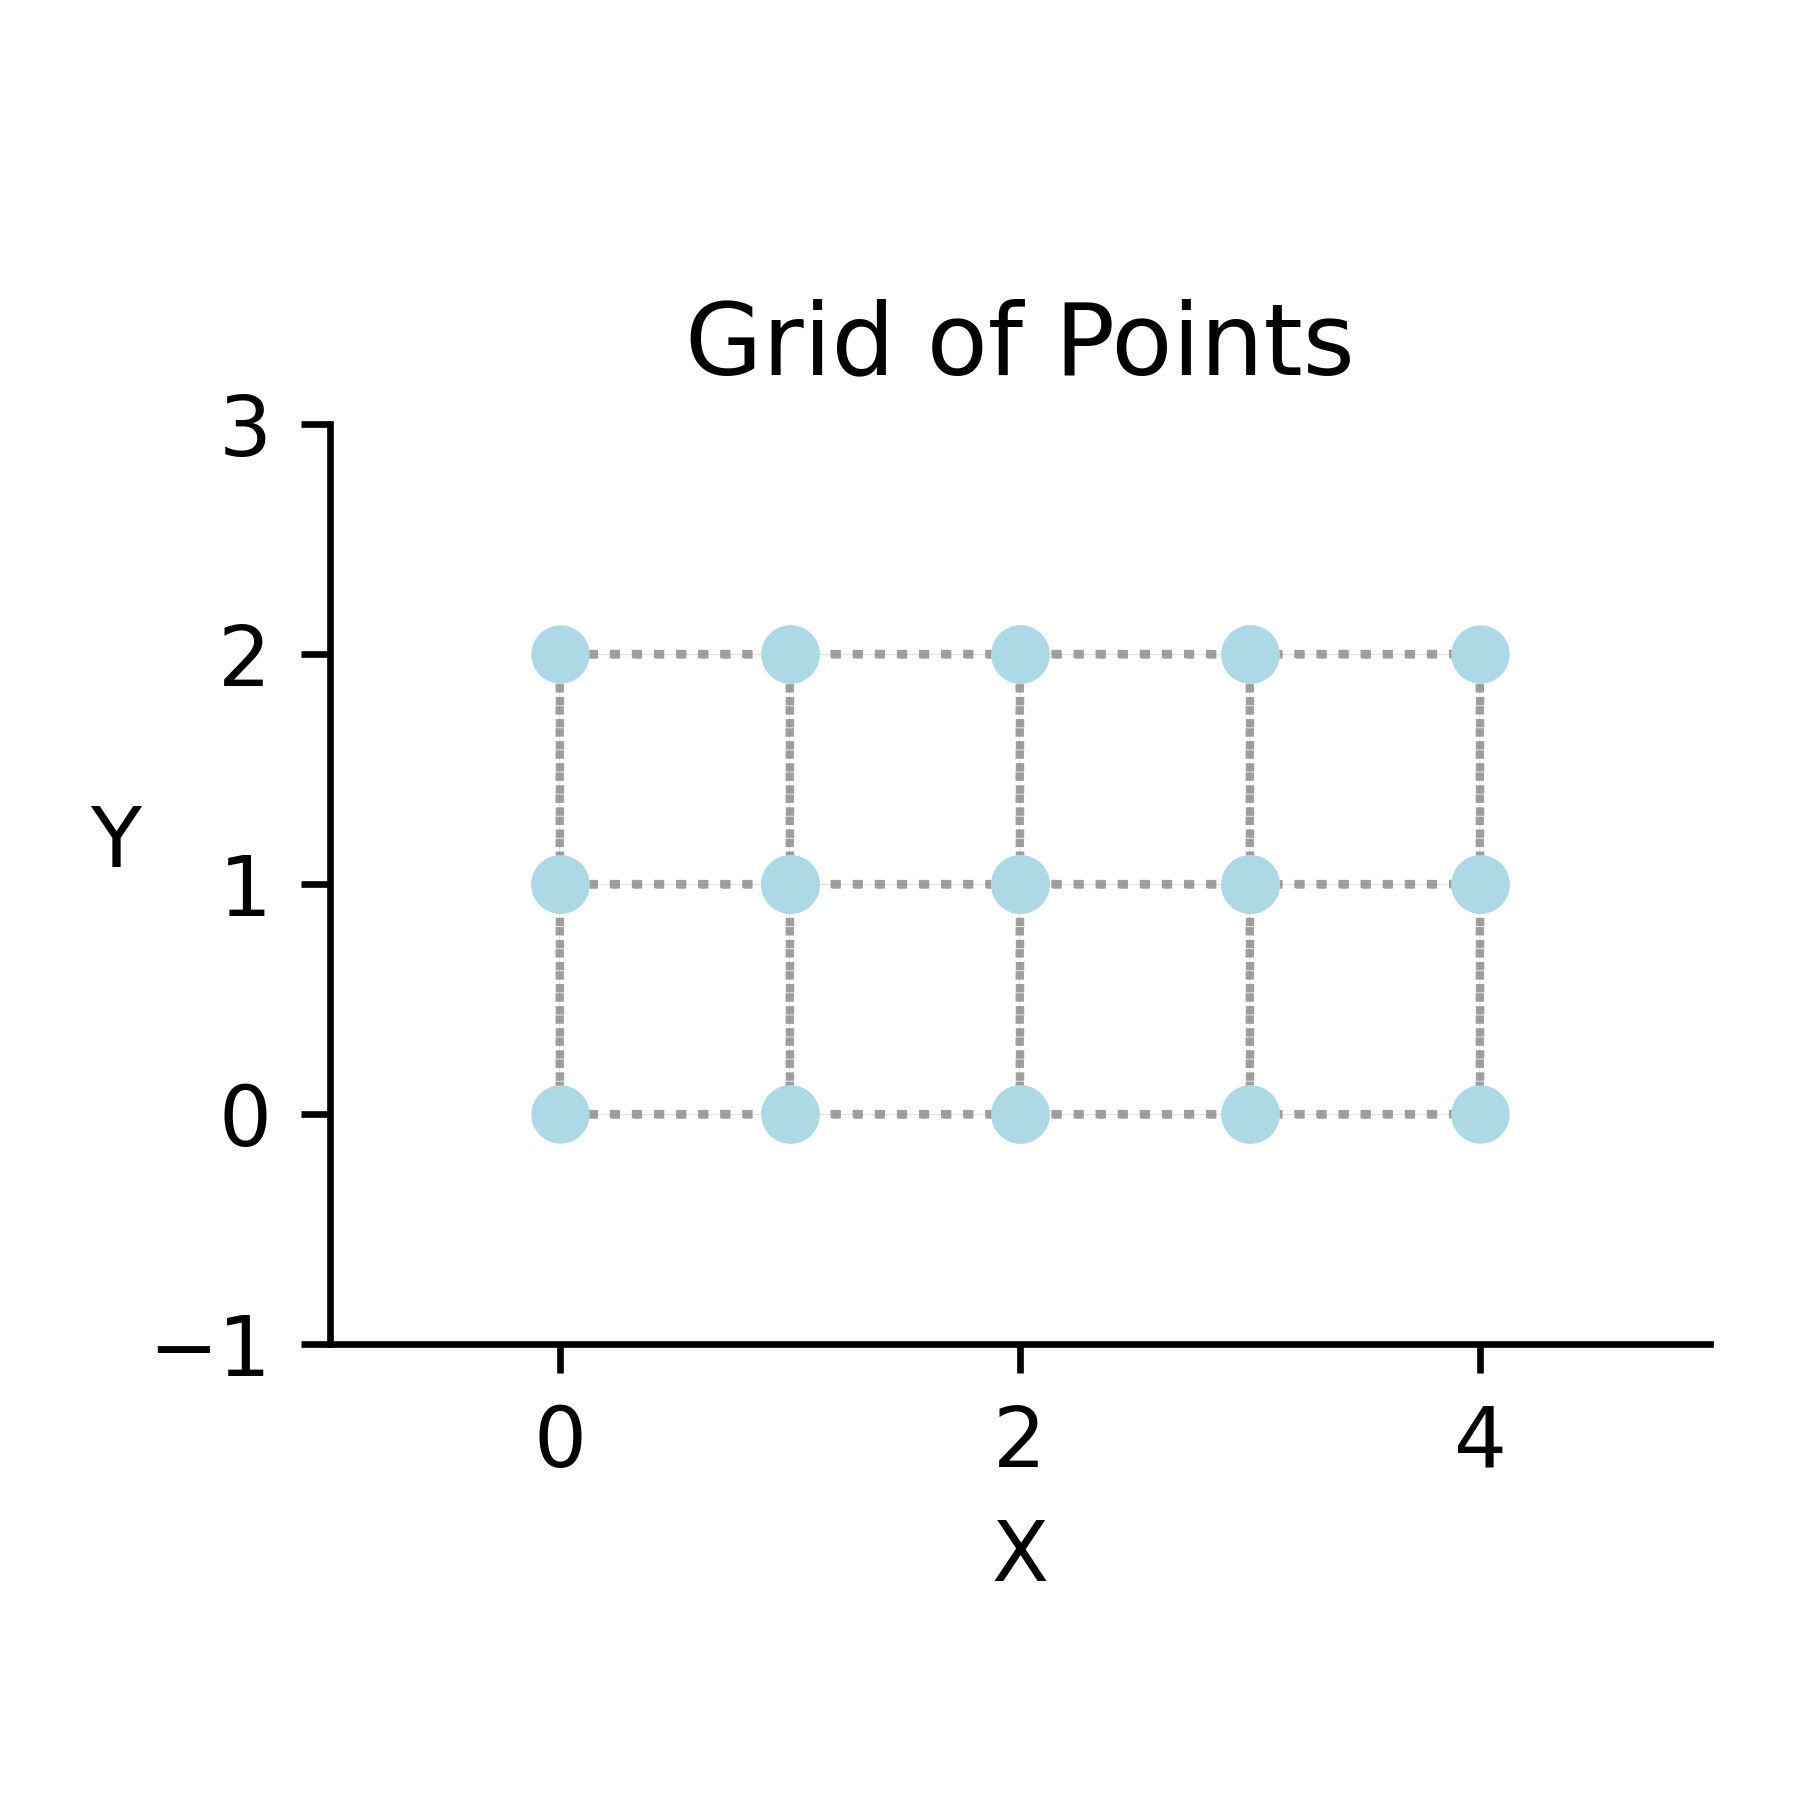
Using the concepts that you’ve acquired, create a “common chart” figure like the one below.
Exercise 3#
Description
Follow the instructions in the notebook chapter_2_1.ipynb to create a figure like the one below.
Exercise 4#
Description
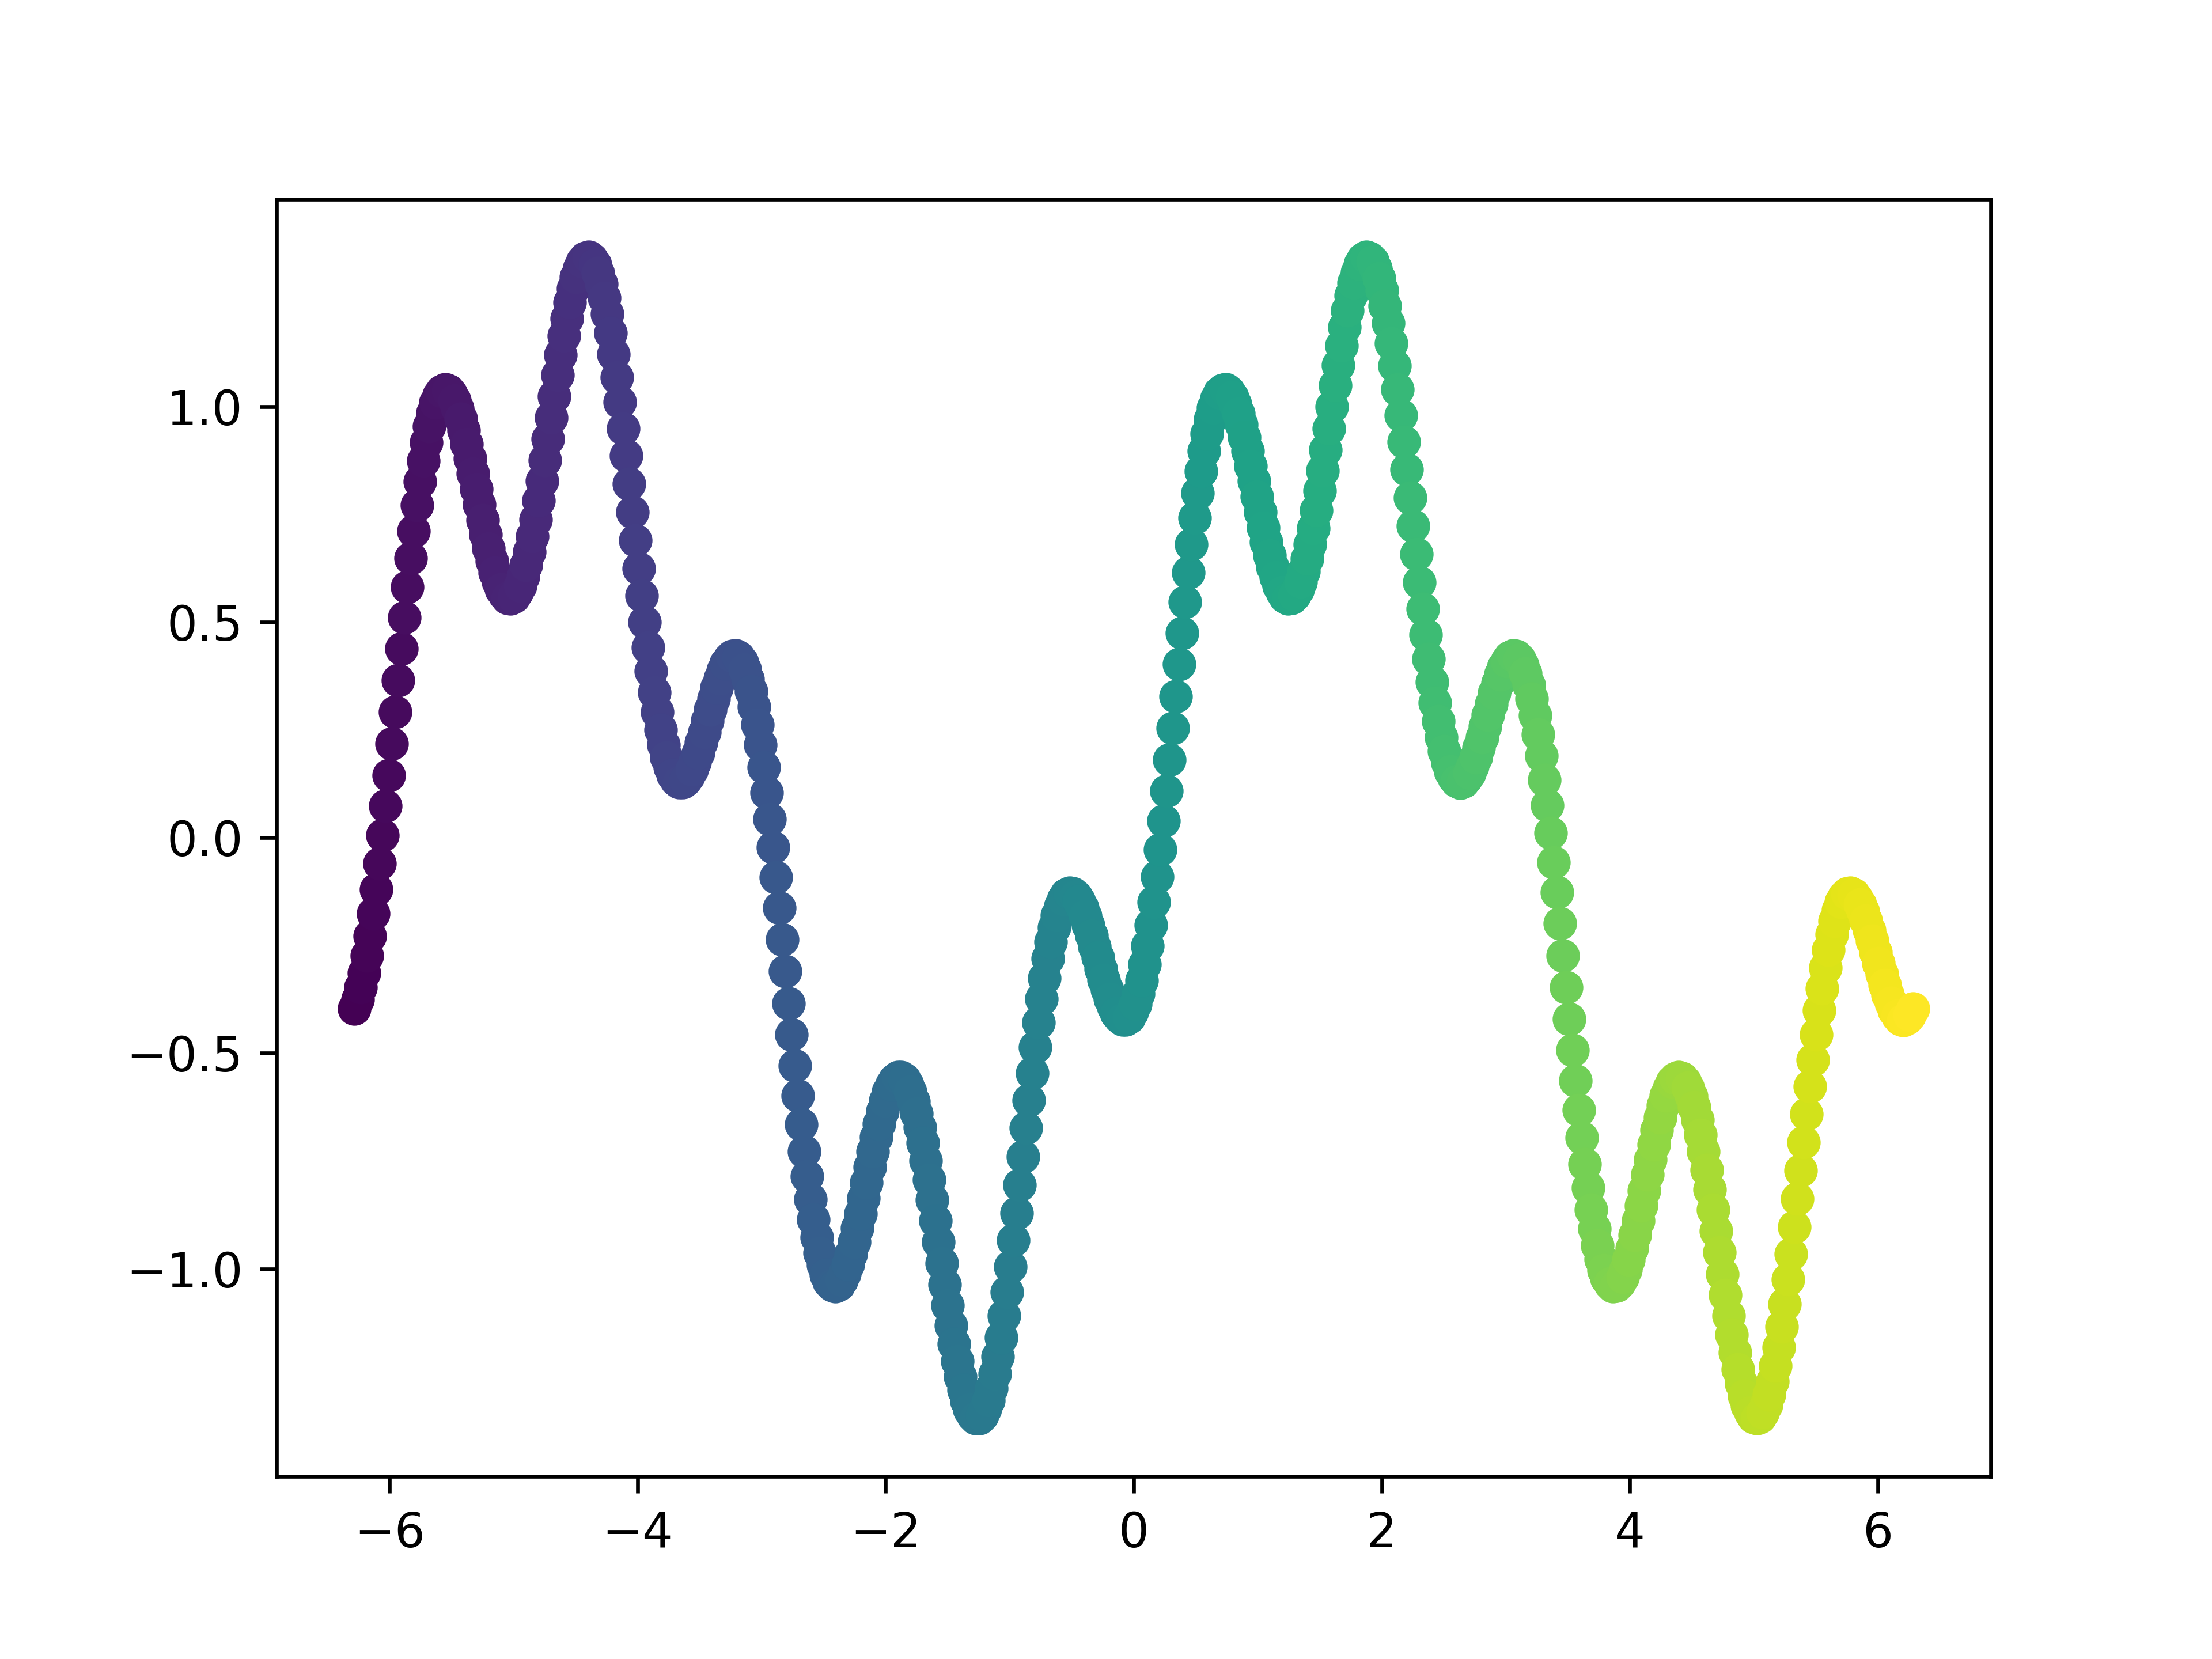
You will be able to create a figure like the one below with ease.
Exercise 5*#
Description
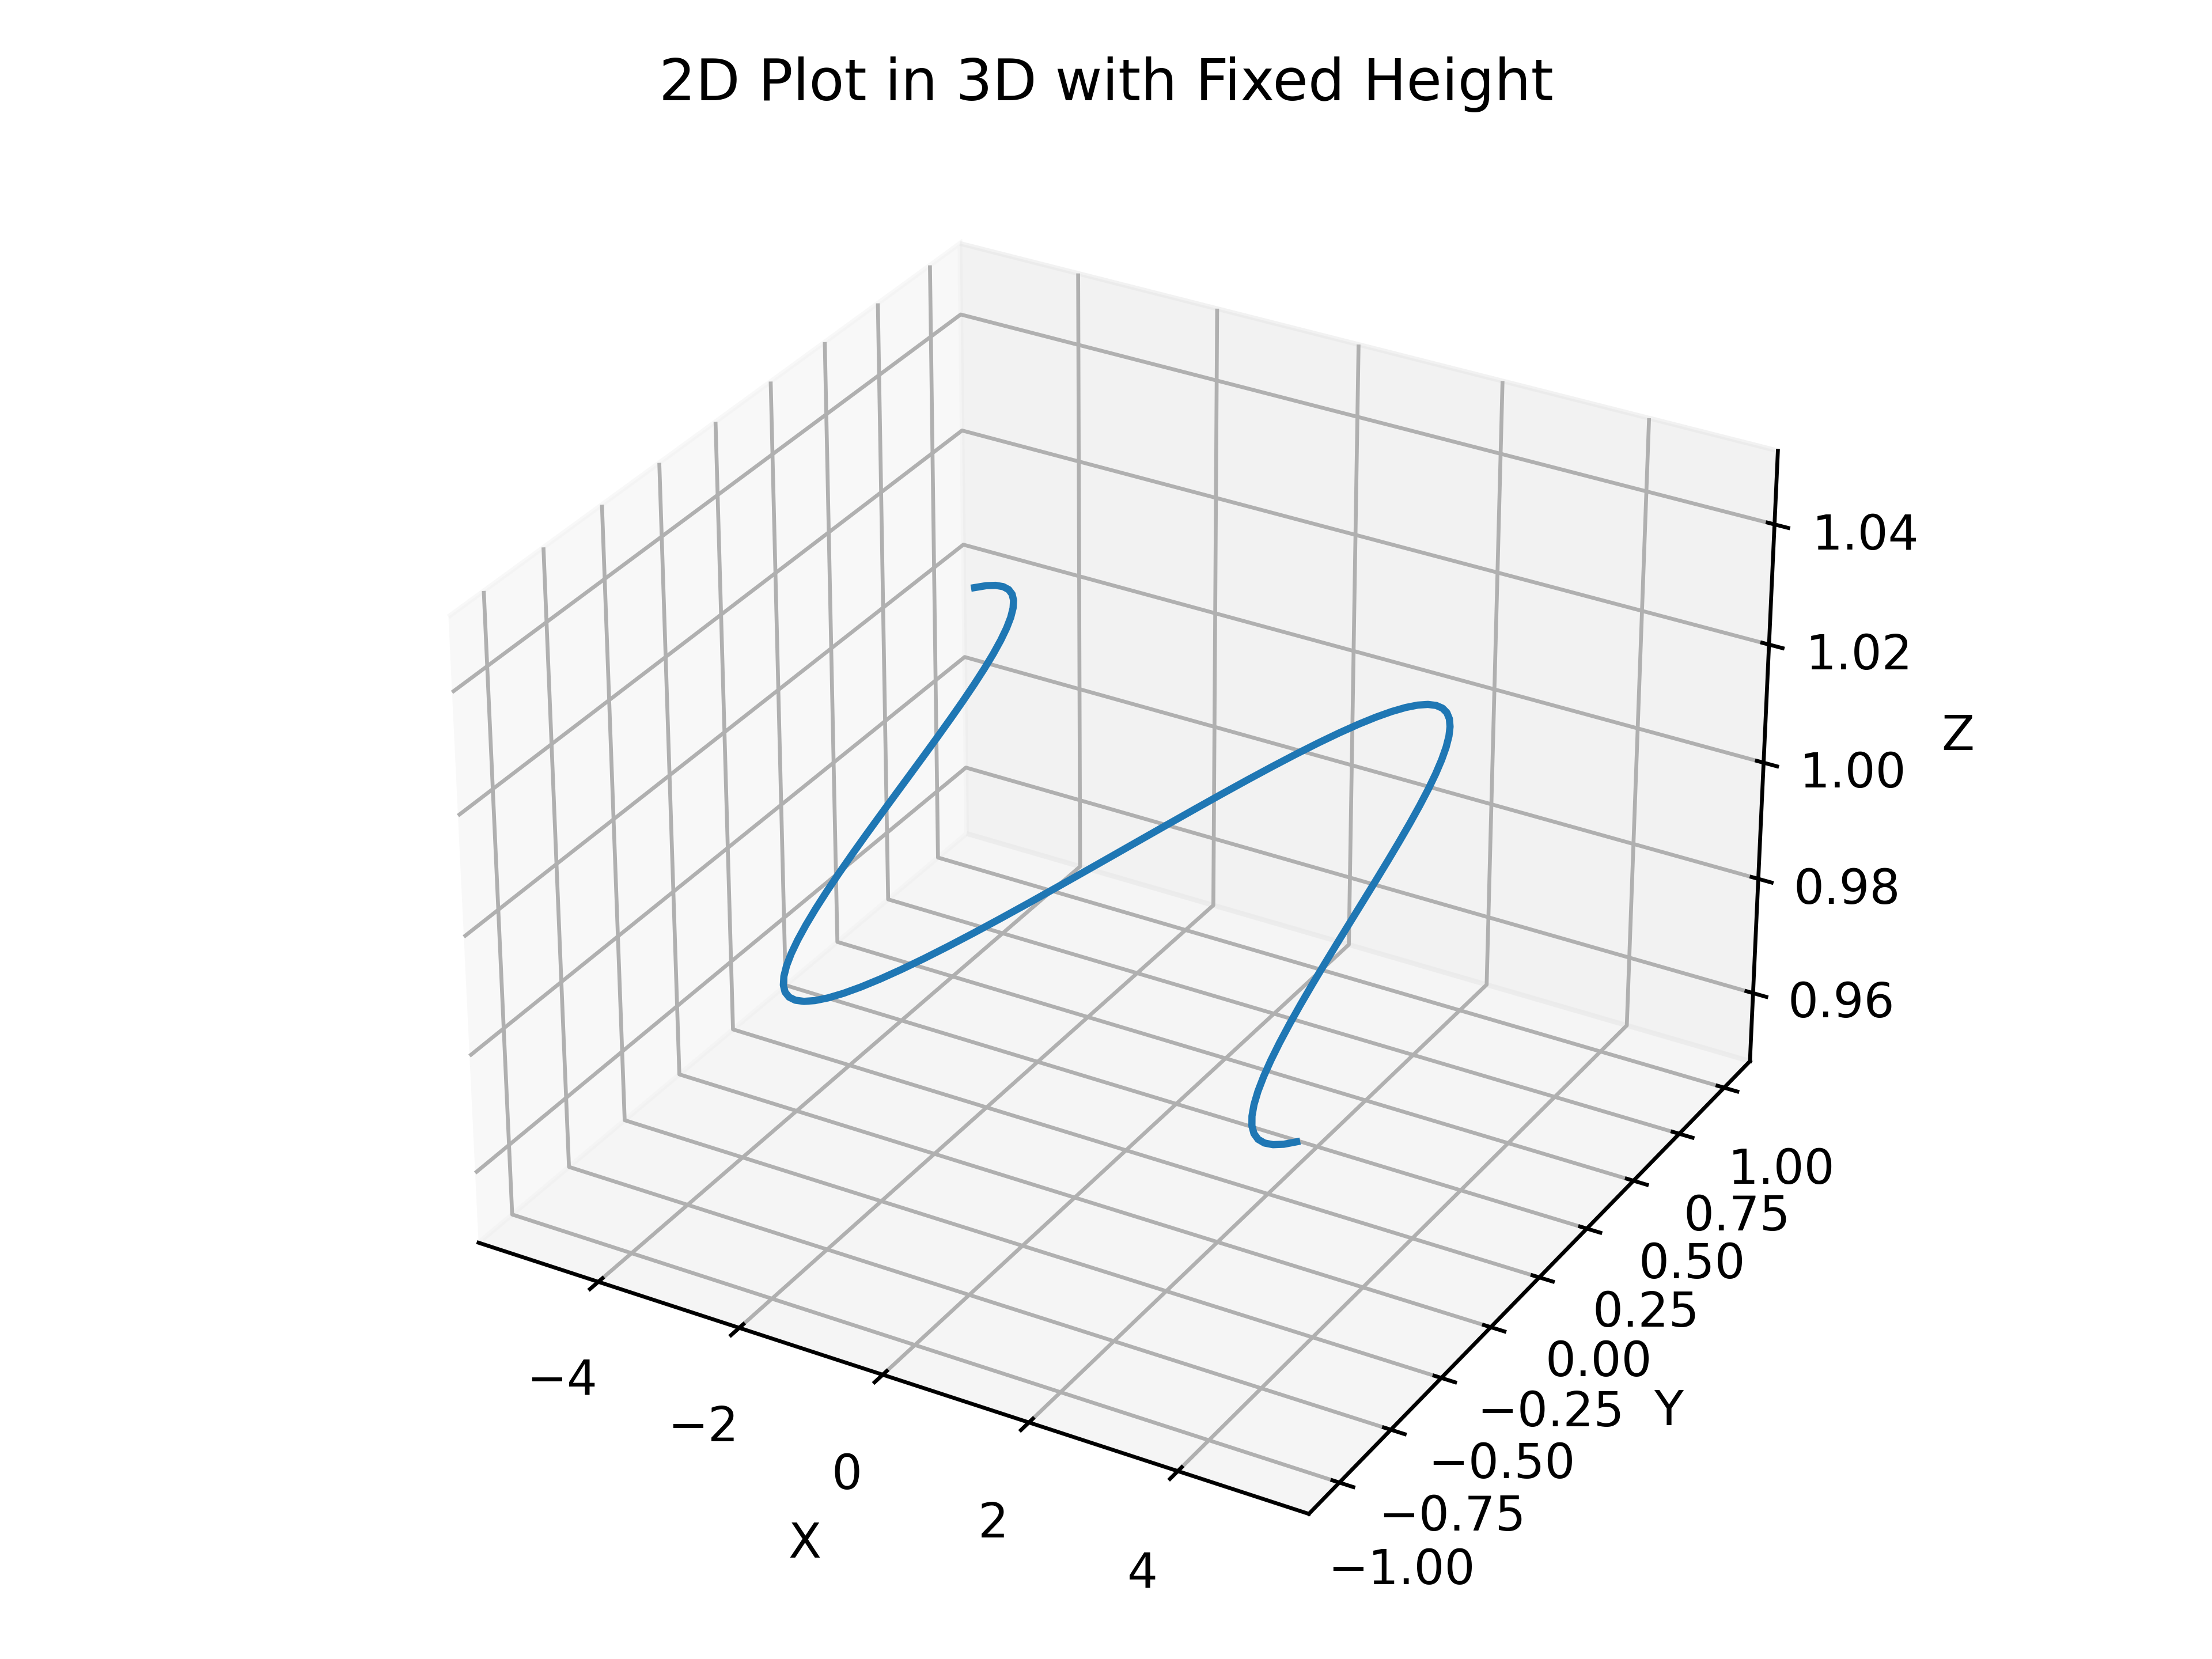
The concepts similar to those we’ve learned about 2D graphics can be applied to 3D. The star in the exercise means that it’s a bit more challenging.
Exercise 6*#
Description
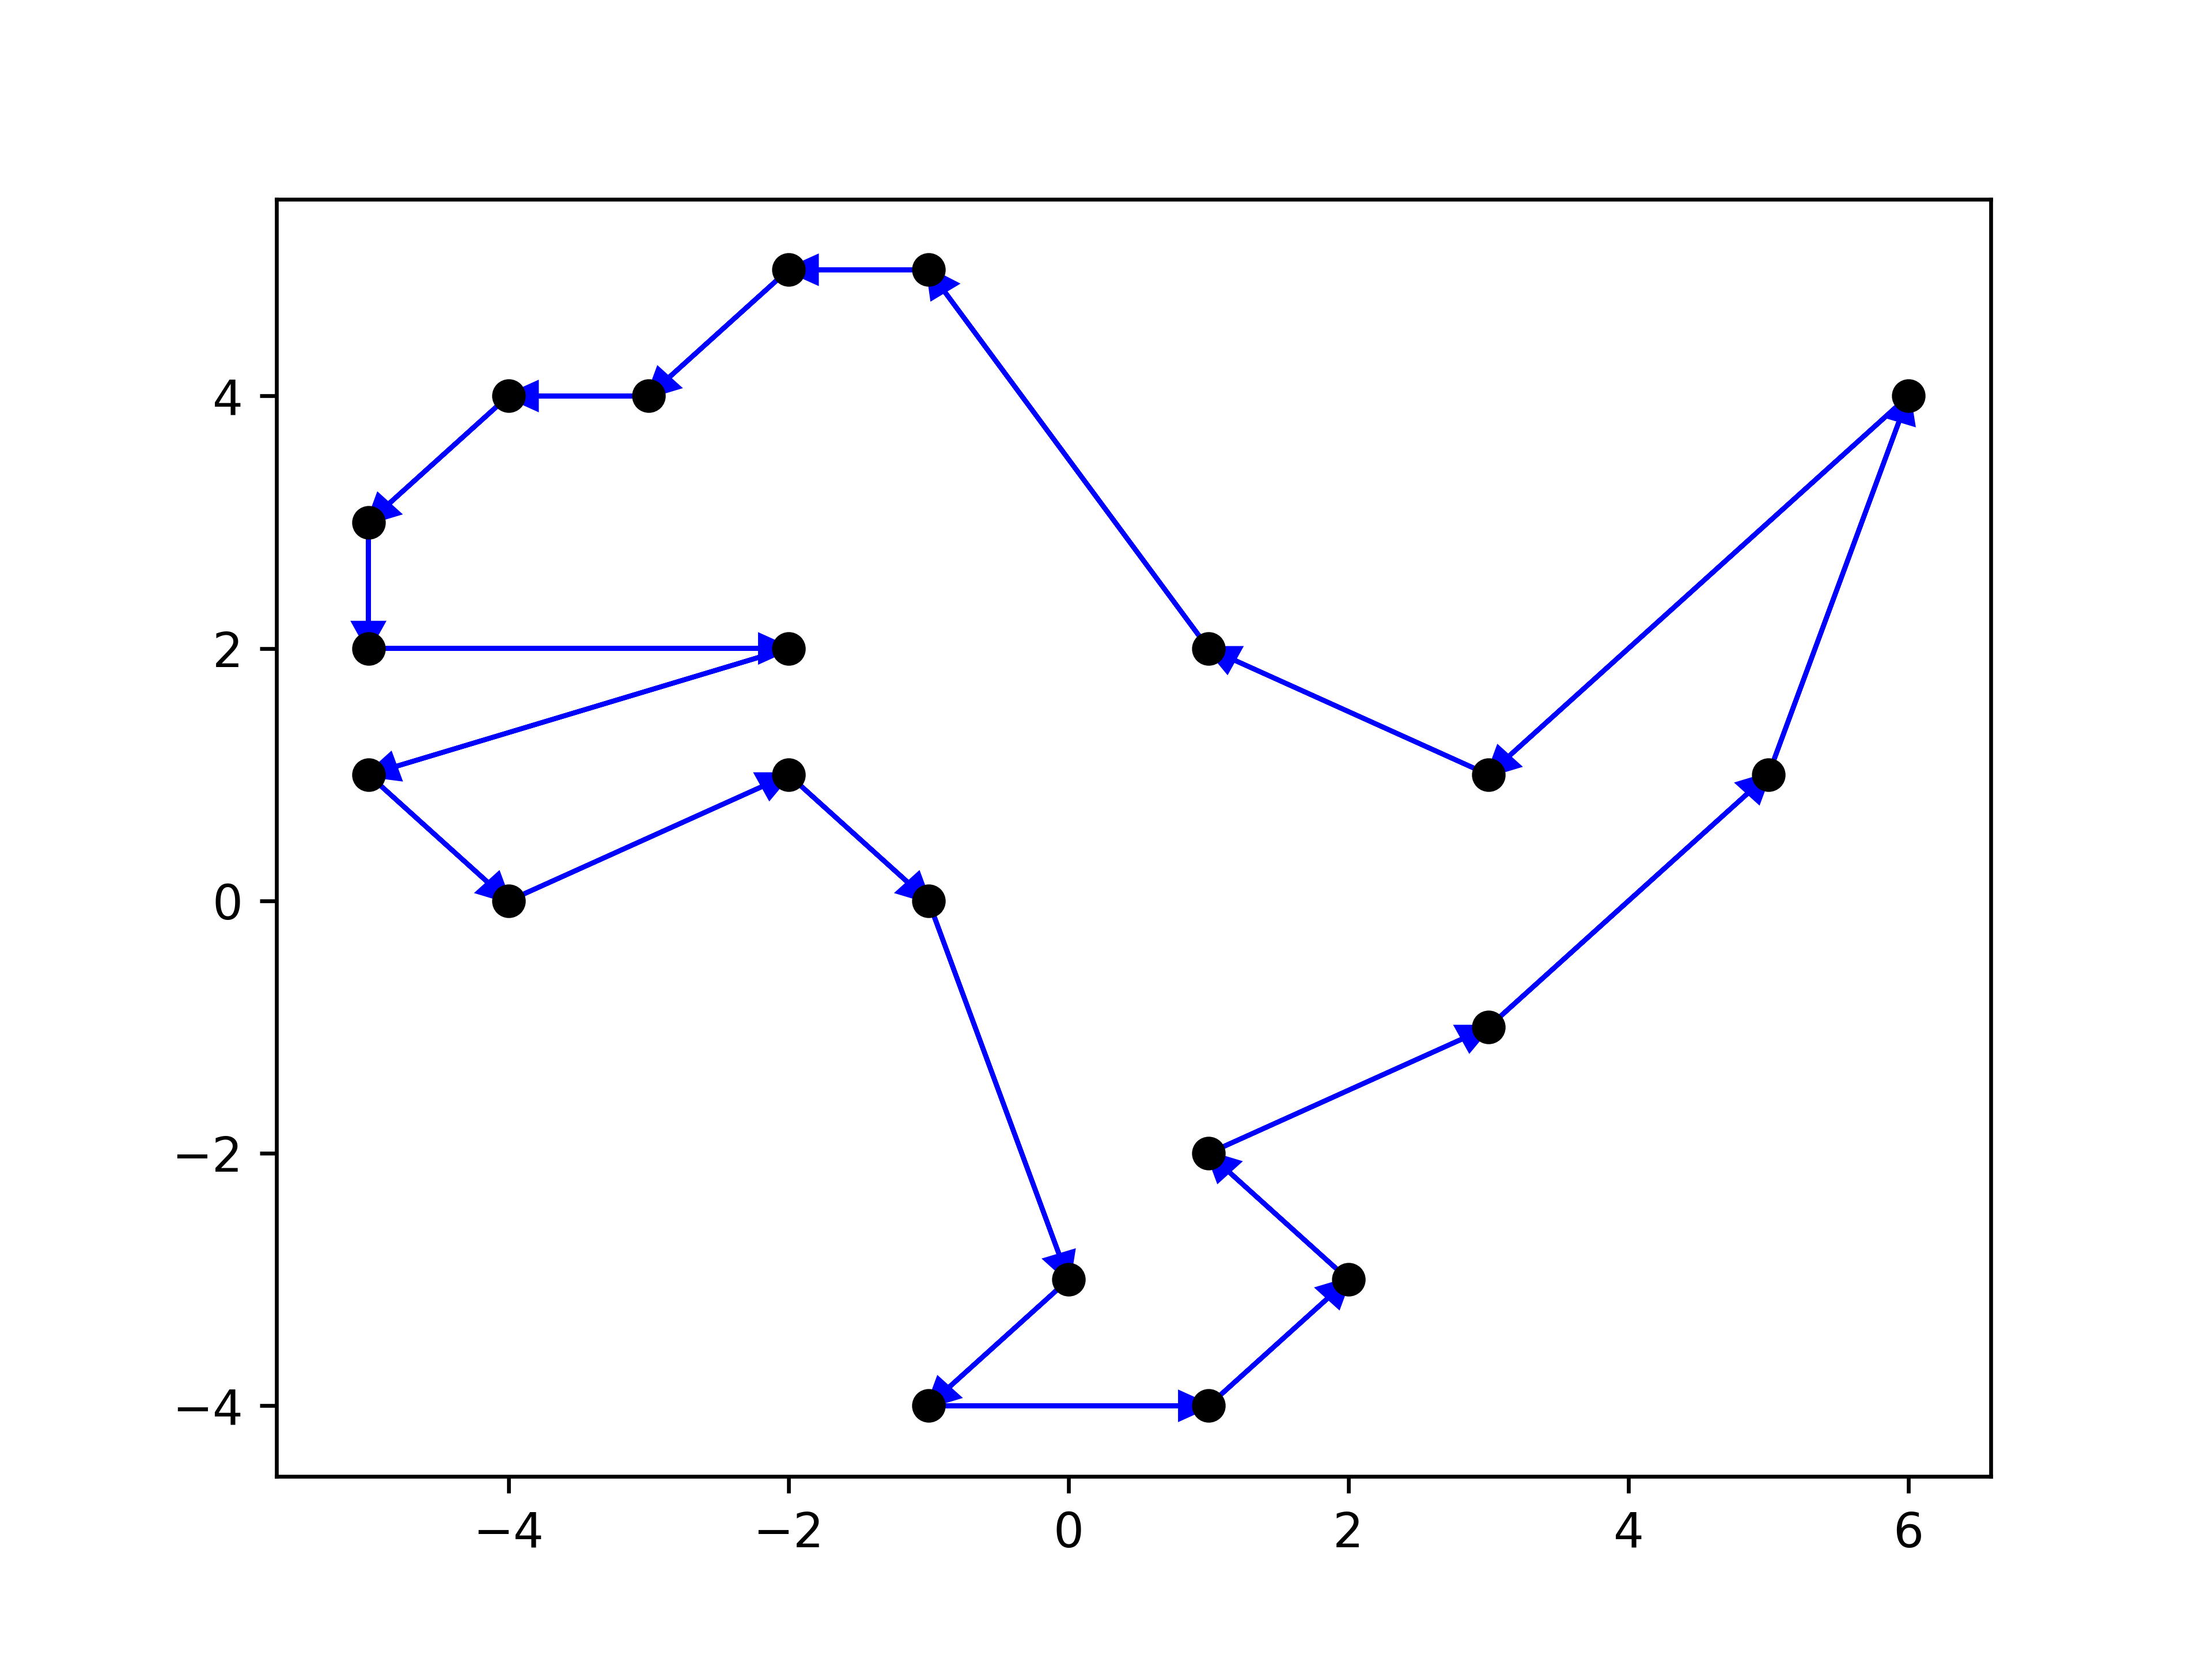
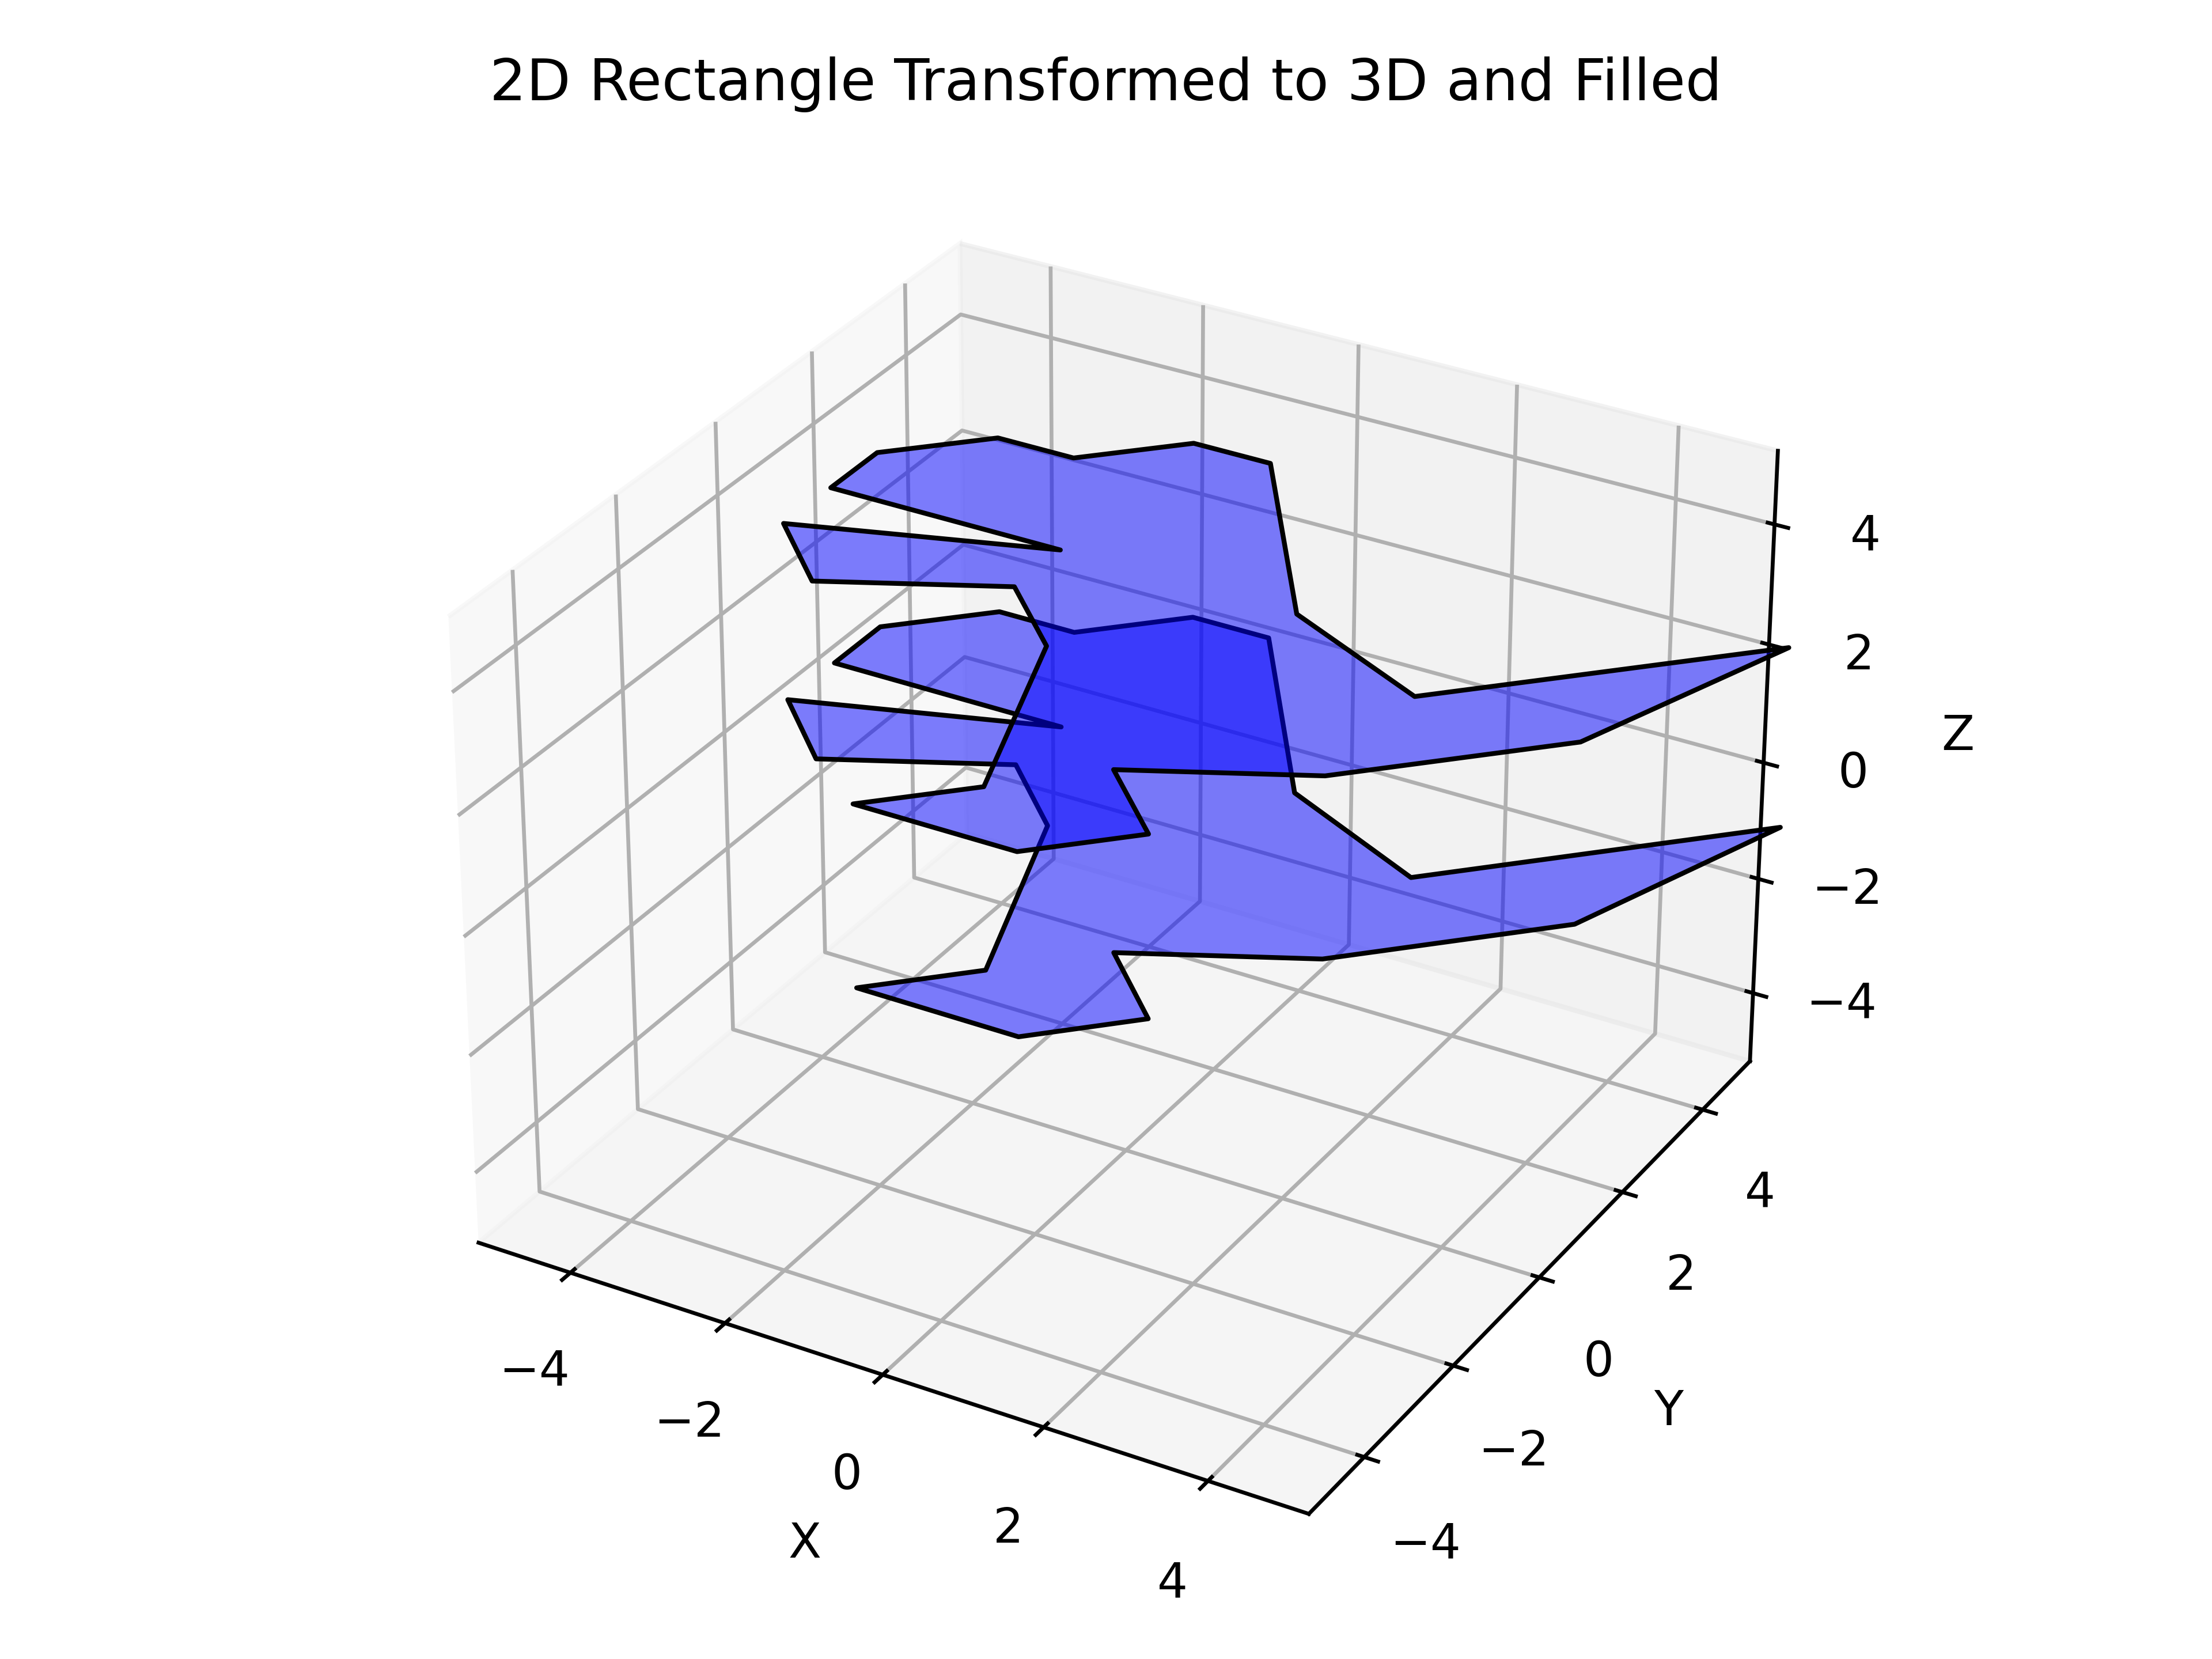
We will be able to generate a dyno even in 3D.
Exercise 7*#
Description
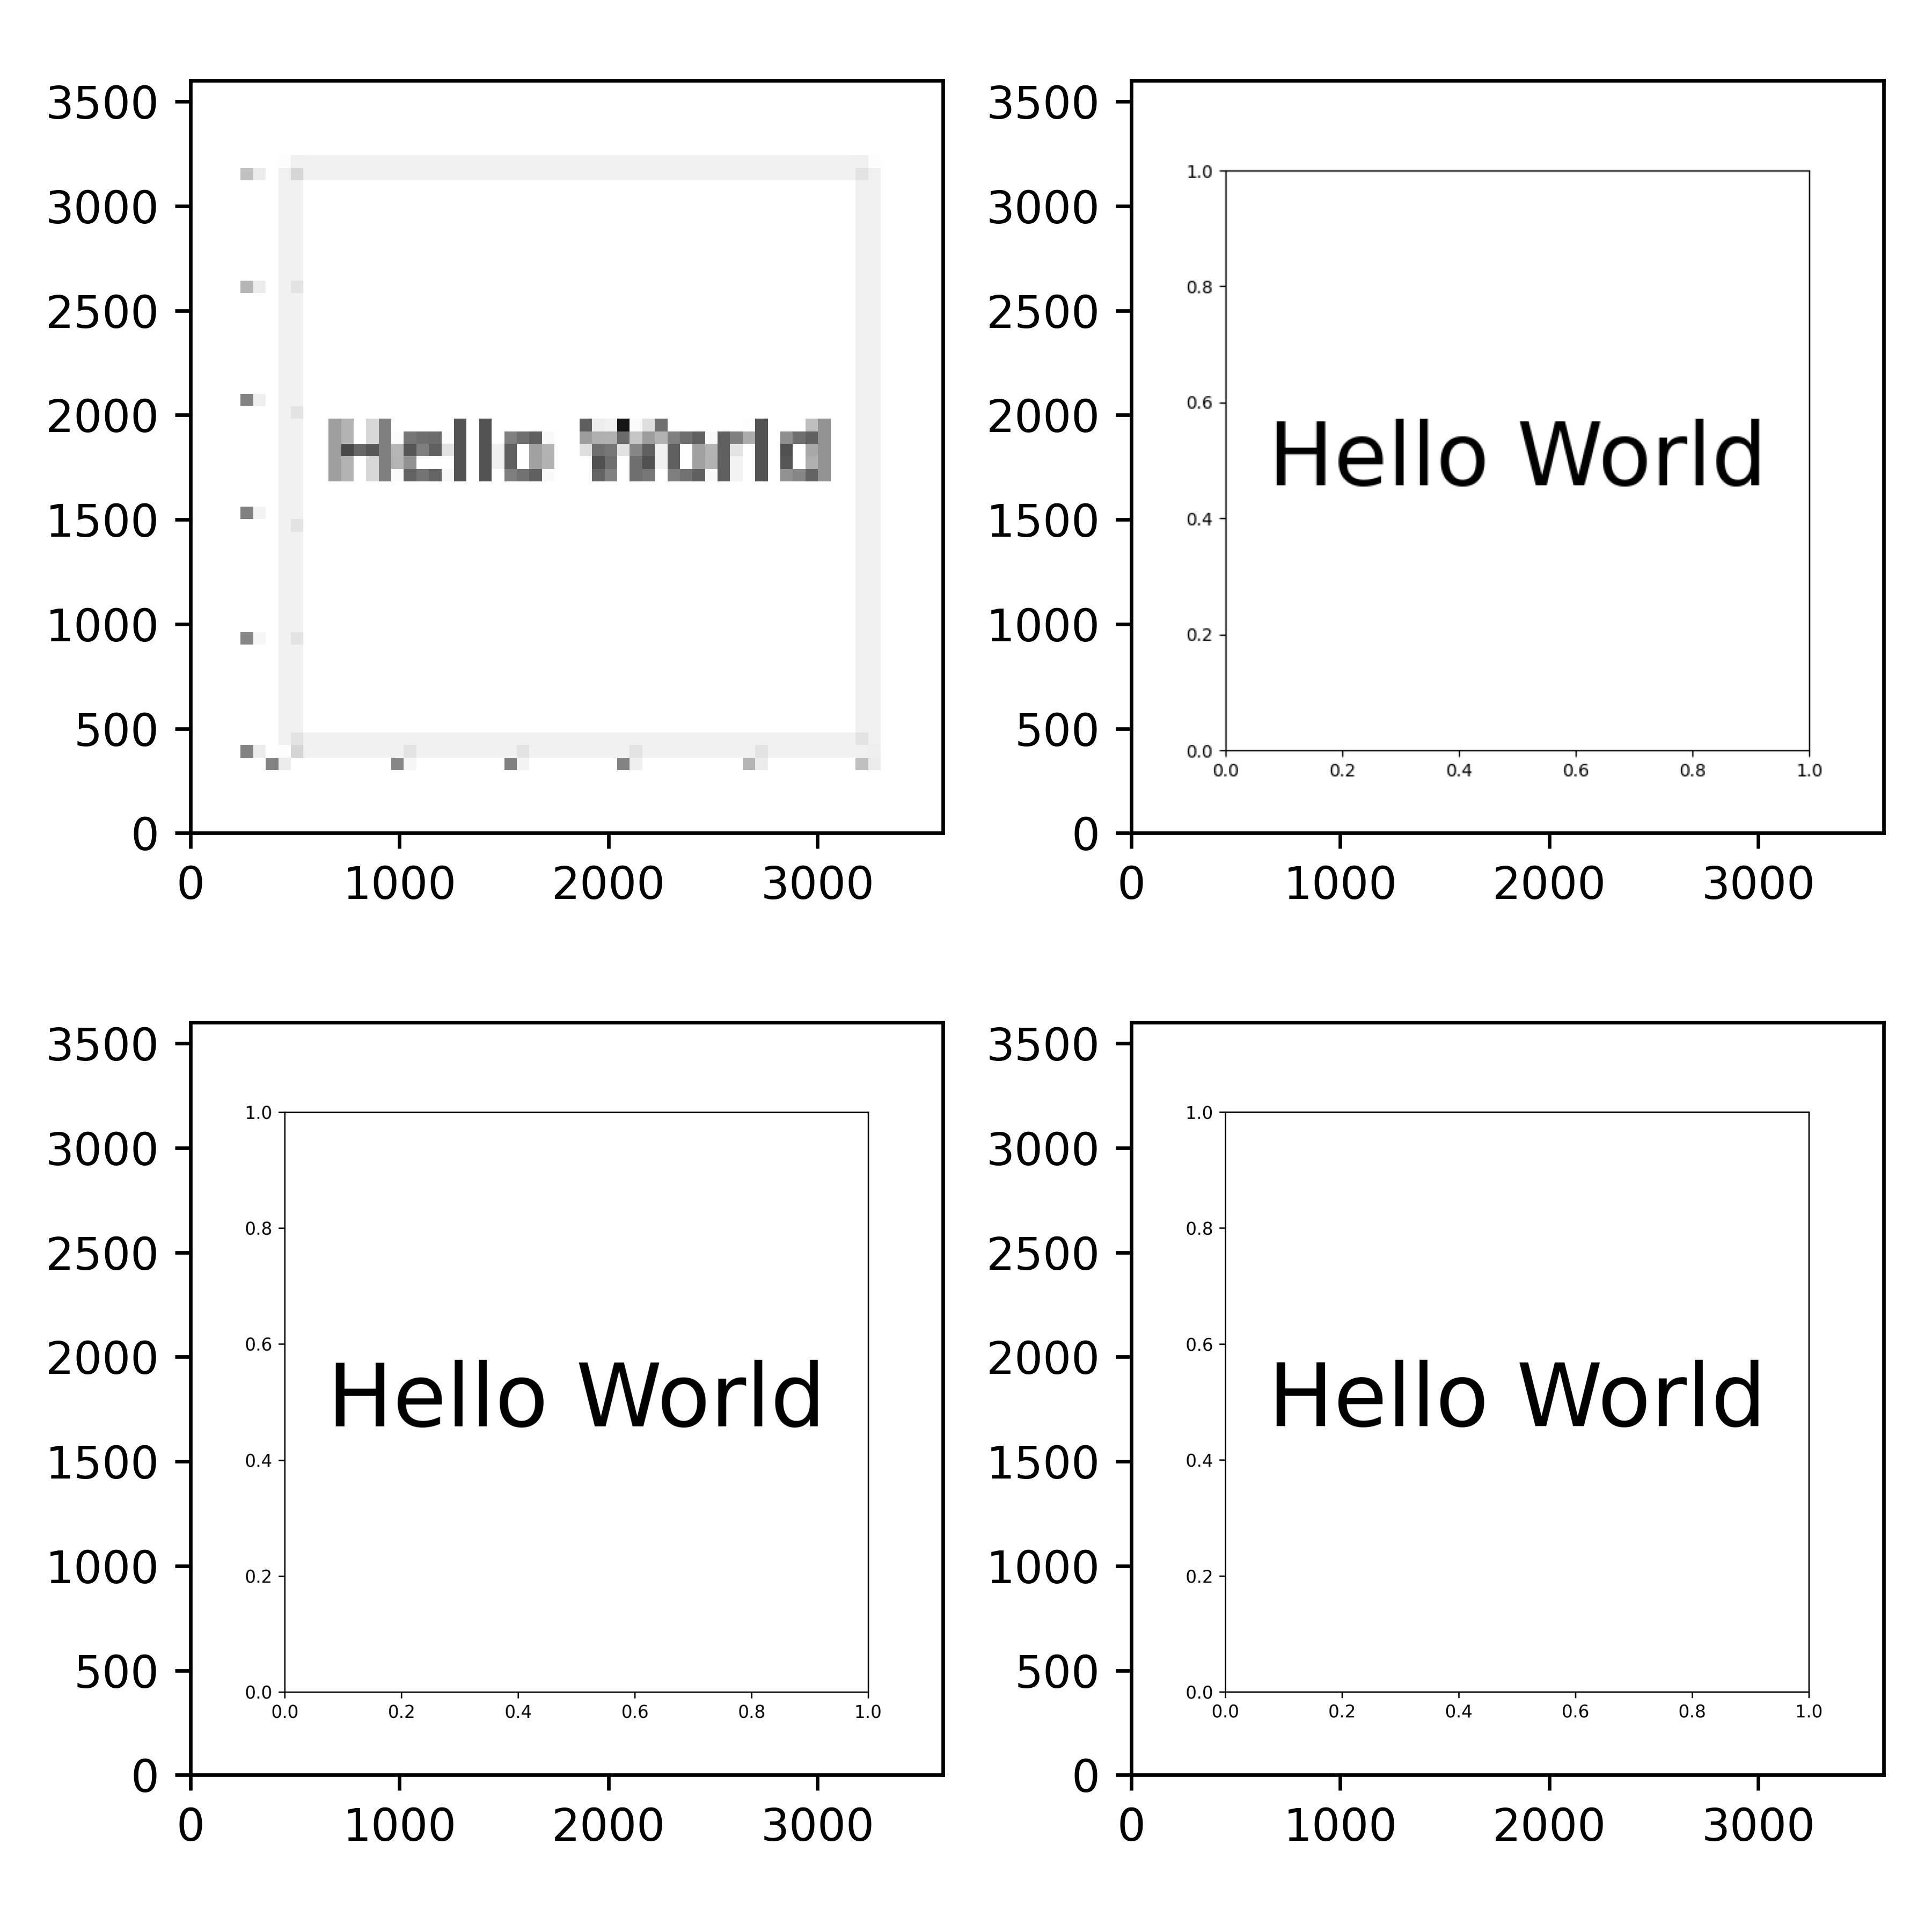
It is always a good reminder to use a proper DPI and dimensions for the figure. Create a figure to demonstrate the difference between the default and custom DPI.
Summary#
We’ve created a simple example of Plot abstraction in Seaborn, a library built on top of matplotlib. https://seaborn.pydata.org/generated/seaborn.objects.Plot.add.html
When you watch the examples in Seaborn documentation, it’s quite impressive what you can build with matplotlib source.
The goal of this section was to demonstrate Artem’s way of navigating complex codebases.
We’ve learned: * how to explore the Figure and Axes objects.
how to create a simple abstraction for plotting common patterns.
how to leverage the advantages of structuring code in .py files and functions for seamless reusability across projects.
Contrast the original anatomy.py implementation with the refactored structure exemplified in anatomy_of_figure.py, highlighting the benefits of functional organization for clarity and maintainability.
In the forthcoming section, delve into the structuring of data visualization projects for portable functionality.
Use this template as a foundation for crafting new scripts: template.py.